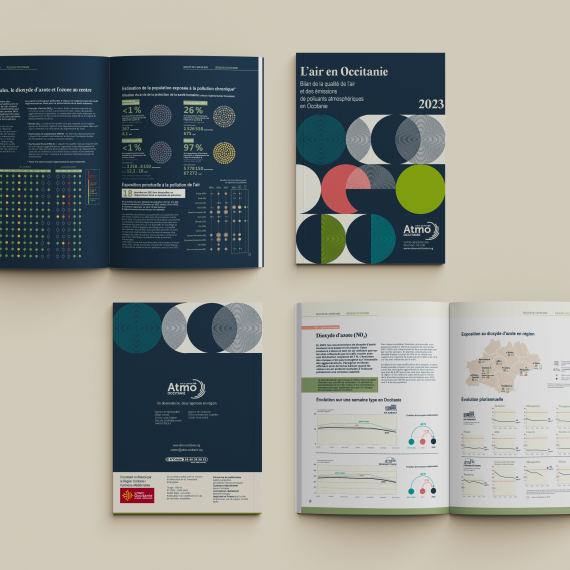
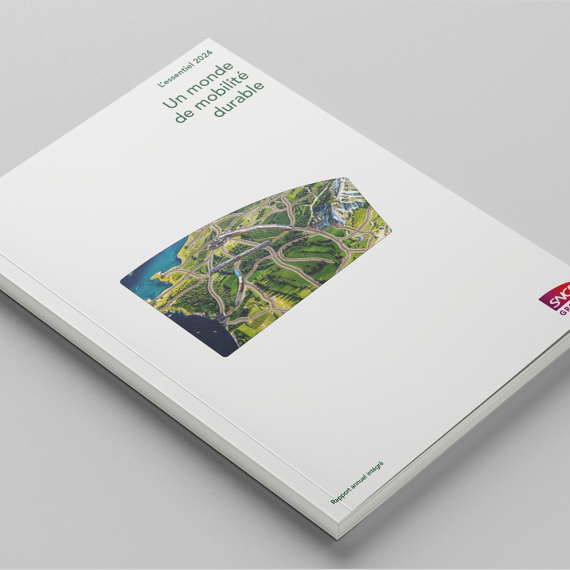
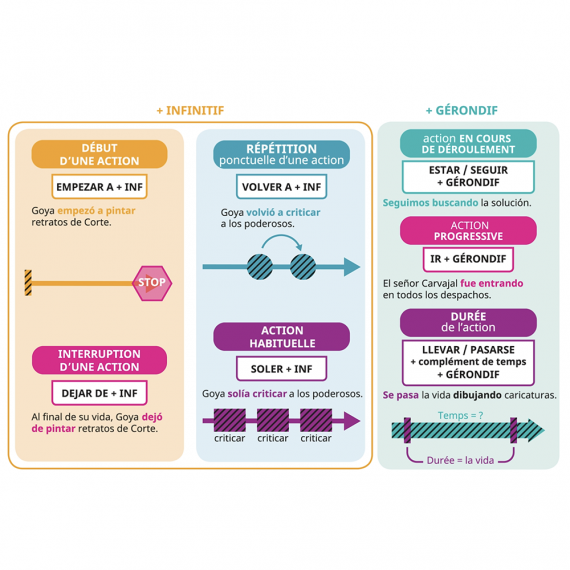
Data visualisation
graphisme d’information
.
Transformer de la donnée en information
Comprendre, expliquer, raconter, enseigner, convaincre
visuellement
– Conseil
– Conception
> Structure d’information
> Storytelling
> Conception d’infographies / data visualisations / dashboards
> Conception de guidelines dataviz (chartes graphiques dédiées) pour plus de cohérence et d’efficacité dans la production de dataviz
– Supports de communication imprimés et digitaux
– Rapports d’activités, études, bilans… : conception de dataviz et mise en page
– Ux, structure d’information et design pour dashboard
– Stratégie/positionnement de projet, Conseil conception, Storyboarding
– Design & refonte d’interface -UI/UX-, notamment pour logiciels et applications ayant besoin de présenter, représenter de la donnée
– Conseil en structure de l’information
It seams that you haven't connected with your Twitter account
Digital creativity unleashed